
Organic Training Needs Analysis
Get a fast, accurate snapshot of what your staff or community members want to learn.
Participants Data Collection and
Insight Dashboard
01
Lever your Group Database for Quick Insights and Efficient Management.
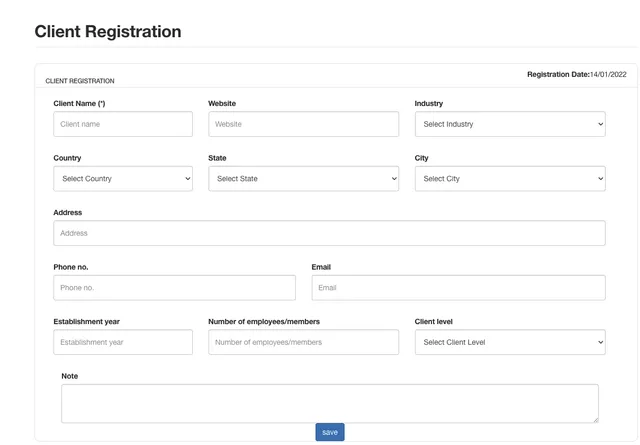
As a host of an event or training session, register the group/school/department/company to which the participants belong.
This enables you to get a macro view of your groups, events, surveys and feedback while also giving you the option to drill right down to find the insights you need.
Registered client/participating group data can be checked on the user's main dashboard, and the status of customer and management information can be checked at a glance.
You can also managed your groups efficiently by categorising them according to industry group, country, size, customer management level or any other KPI relevant to you.
02
Create your Survey to Understand what your Group Knows and What they Want to Learn.
One-click Email notice of attendee inter-personalised matching results and meeting plans. You can use our pre-built survey or customise your own to understand what your group knows and what they want to learn.
Our pre-built survey already contains elements like age, gender, soft skills etc. All you need to add in is the key thing you would like your group to rank (i.e. their method of problem solving, the type of learner they are etc). We can make your life even easier with our library of templates that you can use right away.
Alternatively, you can build your own survey from scratch so that it's tailored specifically for your needs.
The output of this survey can also be used instantly for the
AI Matching Algorithm.

03
Examine your Survey Visualisation for an in-depth Understanding of your Group
The Survey Visualisation enables you to quickly see what your group is confident about and what they're interested to learn.
You can use the pivot tables to specifically examine the results of a gender, age group or another sub-category of your group.
The hashtag function is a super handy tool to let your participants identify themselves in a particular cohort, agree with a certain sentiment or self-tag in any other way you feel is useful
The survey data can be exported in a CSV format and the Survey Visualisation can be shared with other stakeholders. Also, the Survey Visualisation forms part of the full Event Report after your participants share their feedback at the end of the learning interaction.

WHERE TO FIND US
Greenway Hub, TU Dublin,
Grangegorman Lower, Dublin 7,
Ireland